Background
The objective of this lab was to explore the basic principles of photogametry. Specifically, we focused on ways to calculate the scale of digital images, measuring perimeters and areas, an introduction to stereoscopy, and orthorectification.
Methods
Scales, measurements and relief displacement
Calculating scale of nearly vertical aerial photographs
EXAMPLE ONE
In calculating the scale of an aerial photograph we used the
S= Pd/Gd equation, where S = scale, Pd = photo distance, and Gd = ground distance. The following is an example from calculating the scale from an image of Eau Claire, Wisconsin.
What is the scale of the aerial photograph?
S=Pd/Gd
S=2.7''/8822.47’
- In this case the 2.7 inches was collected by using a ruler measuring the photo distance from the computer monitor
- Convert to same units
S=2.7/105869.64
- Divide both the numerator and denominator by 2.7''
- The result will give you the scale with 1 being the numerator
S=1/39211
EXAMPLE TWO
The aircraft acquired the photograph at an
altitude of 20,000 ft above sea level with a camera focal length lens of 152
mm. What is the scale of the photograph?
The following example utilizes the S = f/(H-h) equation where S = scale, f = focal length, H = altitude above sea level, and h = elevation of the terrain.
S = f/(H-h)
(H) Above sea level: 20,000 ft
(h) Elevation of Eau Claire: 796 ft
(f) Focal length: 152mm
Altitude above ground level (H’): 20,000 ft
- 796ft = 19204 ft
S = 0.152m/19204ft = 0.499’/19204’
- Convert the parameters to the same units
S = 0.499'/ 19204'
- Divide both the numerator and denominator by 0.499'
Measurement of areas of features on aerial photographs
The figure below shows a lagoon located on the side side of Eau Claire, Wisconsin which was used to demonstrate how to determine the perimeter and area of a feature.
- Select the measure tool from the home tab on the Erdas Imagine interface
- Click the "Point" drop down arrow to select the polygon tool: to measure the area
- Form the polygon around the area of the feature and double click to complete the polygon
Area: 37.6255 hectares and 92.975 acres
- To measure the perimeter of the feature select the polyline tool
- Repeat the process of outlining the feature and double click to finish the line
Perimeter: 4199.91 meters and 2.61 miles
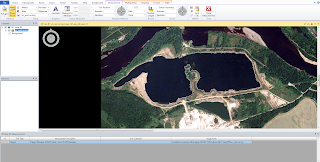 |
| Figure 1. Measuring the perimeter and area of this lagoon in Eau Claire, Wisconsin using tools from Erdas Imagine. |
Calculating relief displacement from object height
Relief displacement occurs when an object is not represented in the correct planimeteric location because of its distance from the principal point and the height of the object itself.
- the taller the object is the more displacement it will have
- the farther away the object is from the principal point the more displacement it will have
The equation used to calculate relief displacement is d= (h x r)/H, where d = relief displacement, h = height of the object (real world), r = radial distance from the top of the object to the center of the principal point, and H = height of camera above the local datum.
EXAMPLE
Determine the relief displacement of the smoke stack identified by the letter ‘A’ on the photograph. Height of aerial camera above datum is 3,980 ft. Scale of the aerial photograph is 1:3,209. (hint: using a ruler measure height of the smoke stack and find its real world height; then measure the radial distance between principal point and top of smoke stack). Report your answer in inches.
h= (0.5) (3209) = 1204.5’’ (in the real world) : 0.5 was the
photo distance
r=10.5’’ (measurement taken with ruler)
H= 3980’
d= (1204.5’’ x 10.5’’)/3980’
- Convert to the same units
d= (1204.5’’ x 10.5’’)/47760''
d= (1204.5’’ x 10.5’’)/47760 =
+0.352 (above principle
point of elevation)
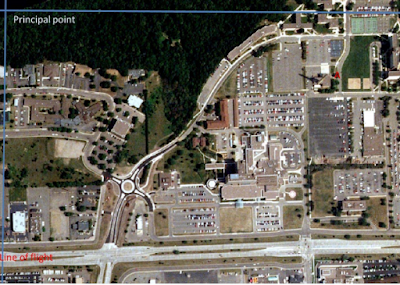 |
Figure 2. Calculating the relief displacement of the tower (A).
Image of UW-Eau Claire's upper campus Eau Claire, Wisconsin. |
In relation to the principal point, what type of
adjustment should be made to the tower?
The tower should be plotted inwards since the displacement
is positive.
Stereoscopy
Stereoscopy is a method used to enhance an image to display a three dimensional view to show variation in elevation, etc. In this section of the lab, the elevation of Eau Claire, Wisconsin was analyzed from the creation of an anaglyph image using a DEM and a DSM.
Creation of anaglyph image with the use of a digital elevation model (DEM)
Two images were brought unto separate viewers and image of Eau Claire with a one-meter spatial resolution and the other image was a DEM of Eau Claire with a 10 meter spatial resolution.
- Click the Terrain tab in Erdas Imagine and select Anaglyph to open the Anaglyph Generation window
- For input DEM select the DEM and for the input image is the other image
- Name the output image and save it to a desired location
- For the settings the vertical exaggeration was set to 1 and other parameters were left as default values
After the image is done processing, it is possible to bring in the image to a new viewer. Use polaroid glasses to analyze the three dimensional aspects of the image.
Creation of anaglyph image with the use of a LiDAR derived surface model
(DSM)
Two images were brought unto separate viewers and image of Eau Claire with a one-meter spatial resolution and the other image was a DSM of Eau Claire with a 2 meter spatial resolution.
The same work flow as the previous example was used to create the anaglyph image from the DSM.
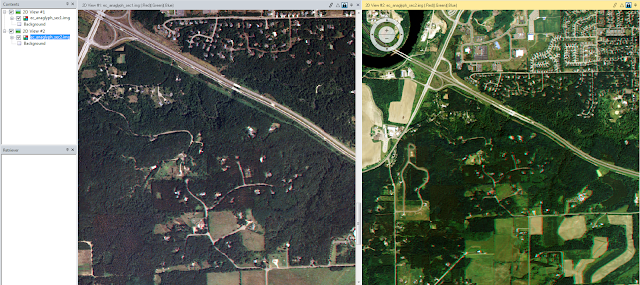 |
| Figure 3. Anaglyph images created using Erdas imagine for the City of Eau Claire. The image on the right is the anaglyph using the DEM while the left image is the anaglyph created from the DSM. |
The anaglyph created from using the DSM image seemed to have less releif displacement than the anaglyph created from the DEM. This could be attributed to the fact that the DSM had a spatial resoultion 2 meters instead of 10 meters as with the DEM.
Orthorectification
Create a new project
Open the LPS Project Manager by clicking the Imagine Photogrammetry under the Toolbox tab
Create New Block File
In the Model Setup Window- the Polynomial-based Pushbroom category and SPOT-Pushbroom were selected
Select a horizontal reference source
Block Party Setup will set the horizontal and vertical reference coordinate system which is essential in orthorectifying an image
To do this click the "Set" button for the Horizontal Reference Coordinate System
In the Custom tab of Projection Chooser window the following parameters were set
- Projection type: UTM
- Spheroid name: Clarke 1866
- Datum Name: NAD27 (Conus)
- UTM Zone: 11
- North or South: North
- Horizontal units should be in meters
Adding Images
In the Imagine Photogrammetry Project Manager window click Images (left side) and then Add Frame
-Add the SPOT image and click Show and Edit Frame Properties to edit the Pushbroom settings
-Click Edit and then OK to accept all the defaults
Collect GCPs
To start collecting ground control points (GCP's) the Start point measurement tool needs to be activated
Choose the Classic Point Measurement Tool option and OK-- this will open the Point Measurement window
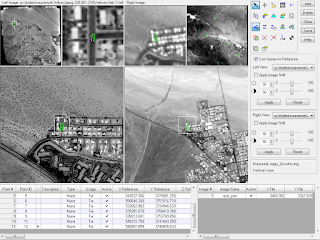
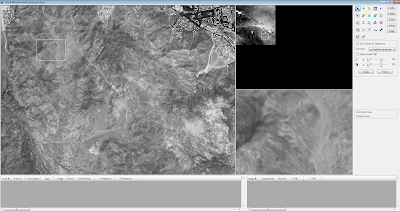 |
Figure 4. The Point Measurement window for creating GCP's for an orthorectified
image in Erdas Imagine showing the three views and toolbar. |
Next, it is necessary to reset the horizontal reference to ensure it is set to Image Layer. After this add the orthorectified image.
Check the box for Use Viewer As Reference
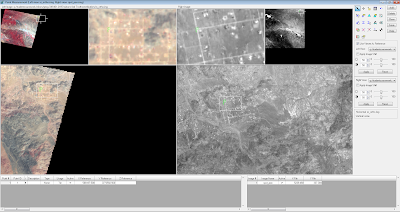 |
Figure 5. Point Measurement window just before GCP collection.
The orthorectified image is on the left and the panchromatic image is on the right. |
When collecting the GCP's move the inquire box to the desired location for the orthographic image. Next, click the Add icon to insert a row for the collection of GCP's.
Then, select the Create Point icon and click the specific location on the orthographic image. select the Create Point icon again and proceed matching the location for the panchromatic icon as well. Repeat the process until all the GCP's are gathered. In this lab we initially gathered eleven ground control points.
At this time the Use Viewer As Reference was unselected and the panchromatic image is the only image in view. The vertical reference was reset to a DEM provided and appropriate settings were determined by the lab handout. The Update Z Values on Selected Points tool was used to choose the same DEM used in the vertical reference settings (the point # was set to none).
Add a second image to the block file
Collect GCPs in the second image
Perform automatic tie point collection
Triangulate the images
Orthorectify the images
View the orthoimages
Save the block file
Results
Conclusion
Sources
Digital Elevation Model (DEM) for Eau Claire, WI
United States Department of Agriculture Natural Resources Conservation Service, 2010.
Digital elevation model (DEM) for Palm Spring, CA
Erdas Imagine, 2009.
Lidar-derived surface model (DSM) for sections of Eau Claire and Chippewa
Eau Claire County and Chippewa County governments respectively.
National Agriculture Imagery Program (NAIP)
United States Department of Agriculture, 2005.
National Aerial Photography Program (NAPP) 2 meter images \
Erdas Imagine, 2009.
Spot satellite images
Erdas Imagine, 2009.


